01
The night before the print
CPI. FOMC. A number that can move everything by morning. You should not be stitching twelve headlines together at 1 a.m. The note is already there: what we are watching, and why it matters to you.


Quant-driven financial research
Monthly global markets coverage, fundamental and quantitative analysis, and a live dashboard — built for investors who want institutional-grade notes without the noise.
Macro & factors
Regime detection, rates, and cross-asset context in one monthly desk note.
Python, SQL & R
Trends, seasonality, and Momentum vs Mean Reversion backtests.
Secure delivery
Reports, dashboard access, and alerts inside a professional workspace.
Monthly global report
Macro, rates, equities, gold, oil, and geo-economic context.
Interactive dashboard
Follow assets and key data in a clean research workspace.
Event alerts
FOMC, CPI, central banks, and major geopolitical releases.
Community names
Two community-selected stocks analysed each month.
Official links
General reports cover the market every month. Special reports are deeper, on-request studies for a stock, event, or custom asset list — both published via Linktree.
linktr.ee
General Monthly Reports
Recurring market coverage
linktr.ee
Special Reports
Bespoke and event-driven research
A note from the desk
We know the feeling: too many charts, not enough time, and a market that does not wait.
That is why the monthly report exists. Not to impress a CIO. To sit next to the person who still opens the tape after dinner, and still has to live with the decision.
Rotterdam desk · written every month
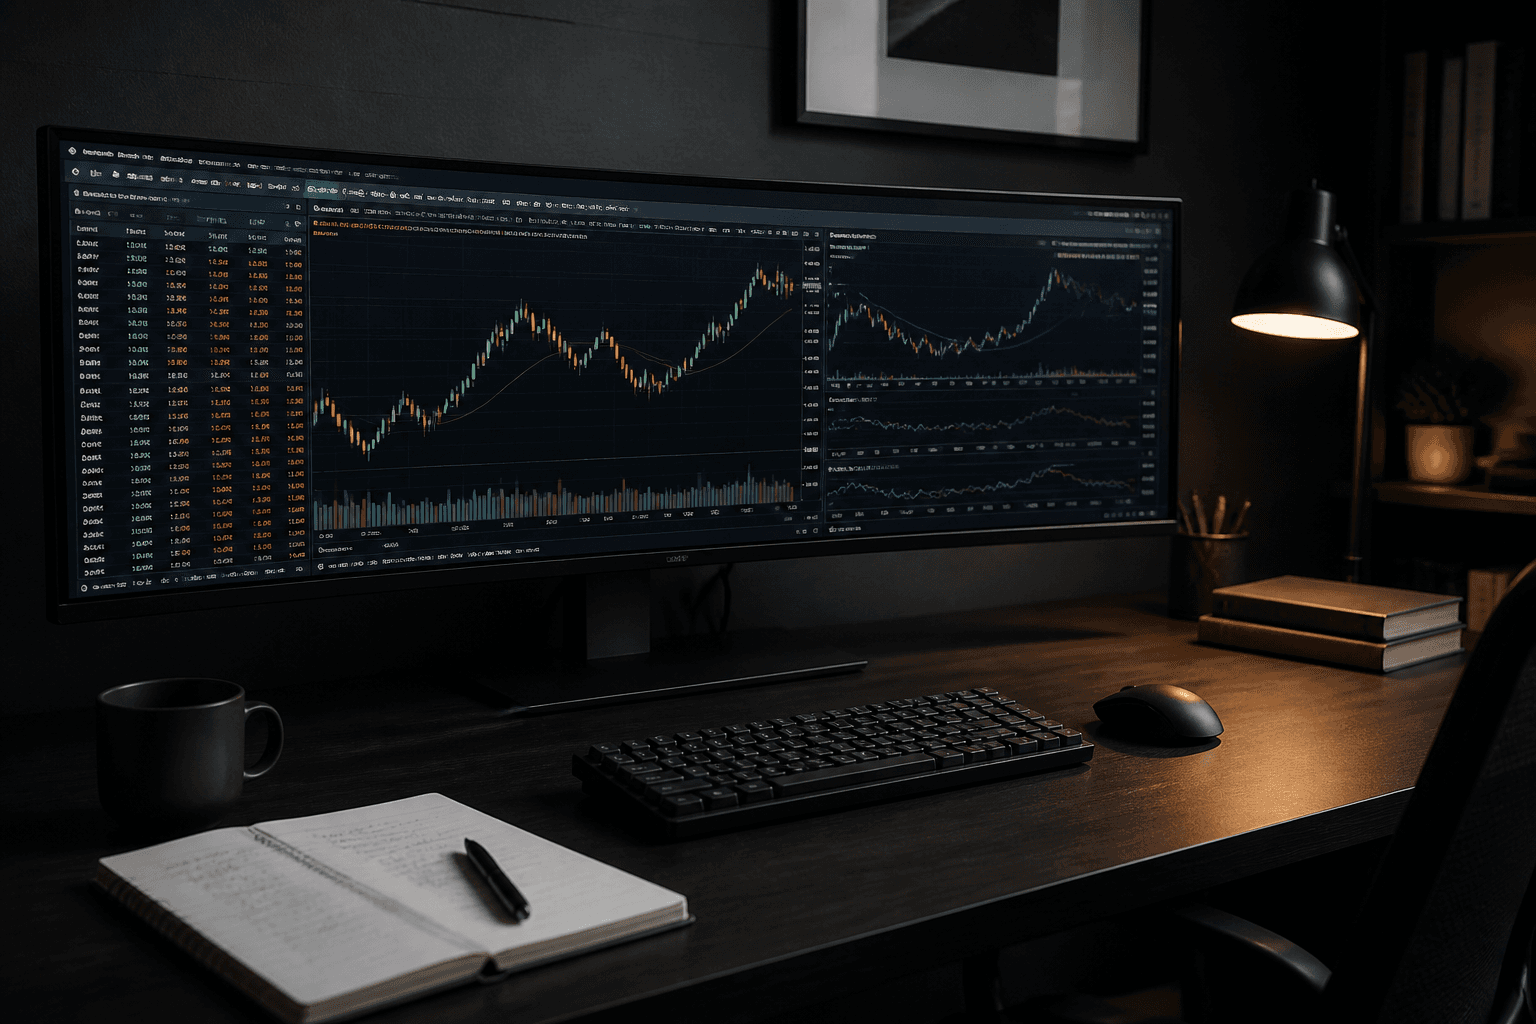
Not for a slide deck. For the investor who still does their own homework.
01
CPI. FOMC. A number that can move everything by morning. You should not be stitching twelve headlines together at 1 a.m. The note is already there: what we are watching, and why it matters to you.
02
Coffee, the chart, and a brief that actually arrived. Macro, rates, gold, oil, and the tape — written so you can decide, not so a committee can nod.
03
You are not a ticket in a queue. Each month the community picks two stocks, and we sit with those names the way a desk sits with a book. Together, not from above.
The desk is small on purpose. You get a monthly brief, a dashboard, and someone who still reads the tape — the way a colleague would, not the way a product would.

The desk
You are not here to learn another platform. You are here so a clear brief lands when you need it — and the dashboard is waiting if you want to go deeper.
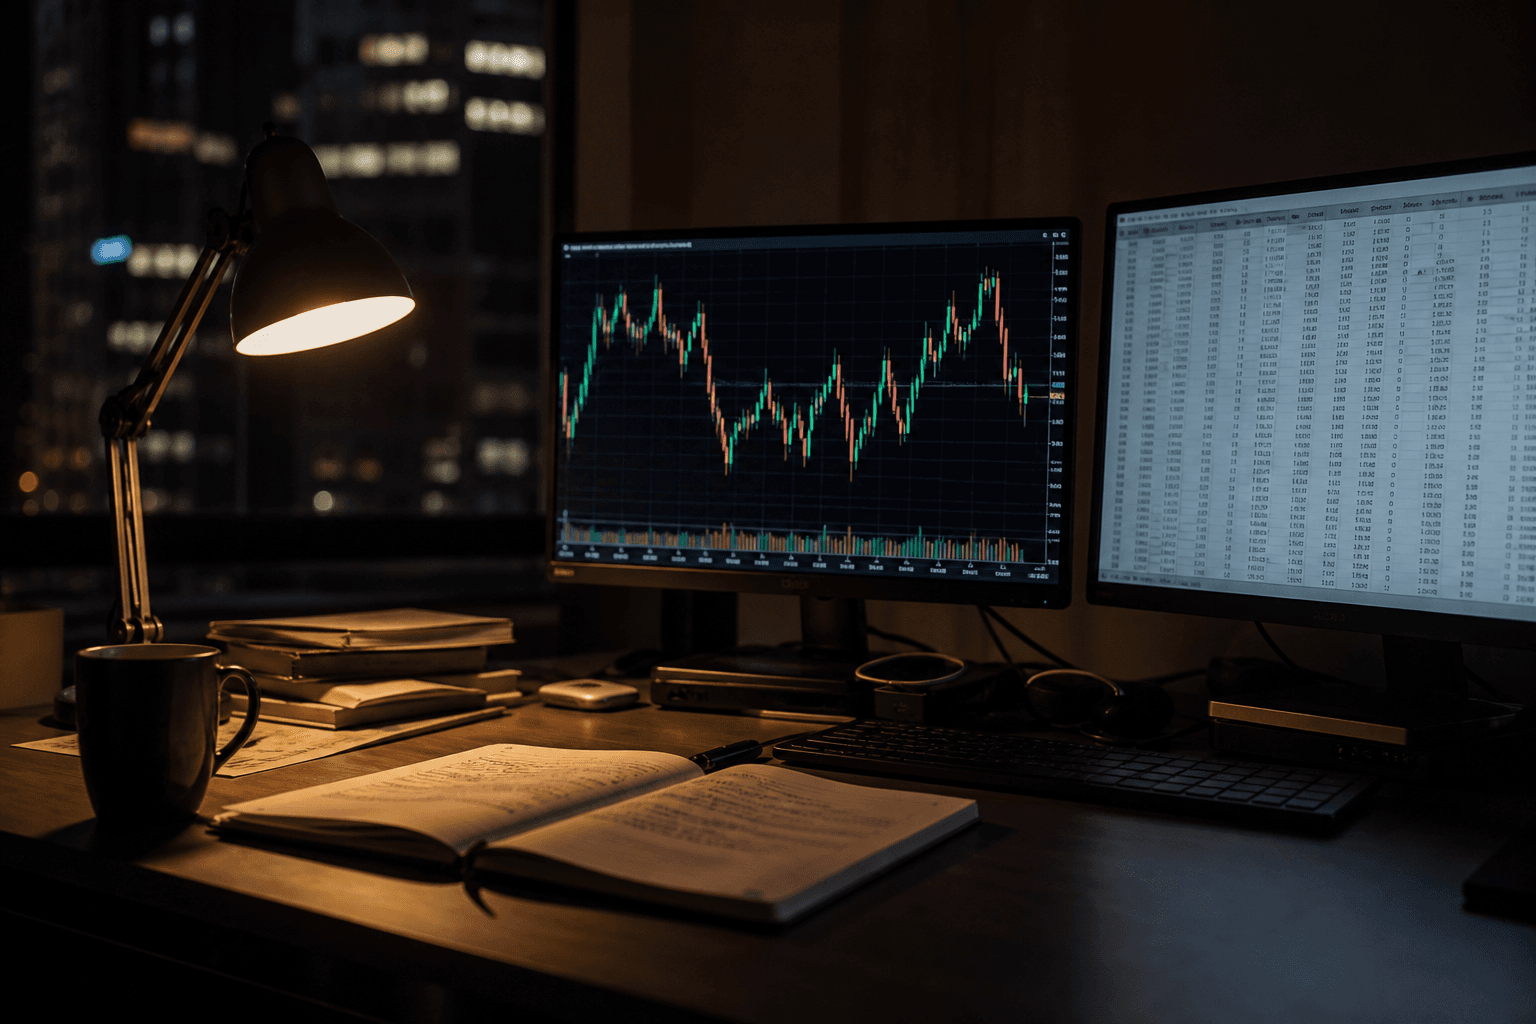
The desk
FOMC. CPI. A shock on the tape. We do not drown you in alerts. We stay with the calendar that can change a month — so you are not alone when it happens.

The desk
Your ticker. Your question. A special report written for that, not for everyone. Small desk on purpose — so you are a name, not a subscription ID.
Plans
Monthly access, or save with 3 months. Same reports, dashboard, and alerts.
$99.99/month
$199.99for 3 months
All prices in USD. Pay with card. Monthly plan renews each month; 3-month plan is a one-time payment for 90 days of full access.